

Summary stat cards
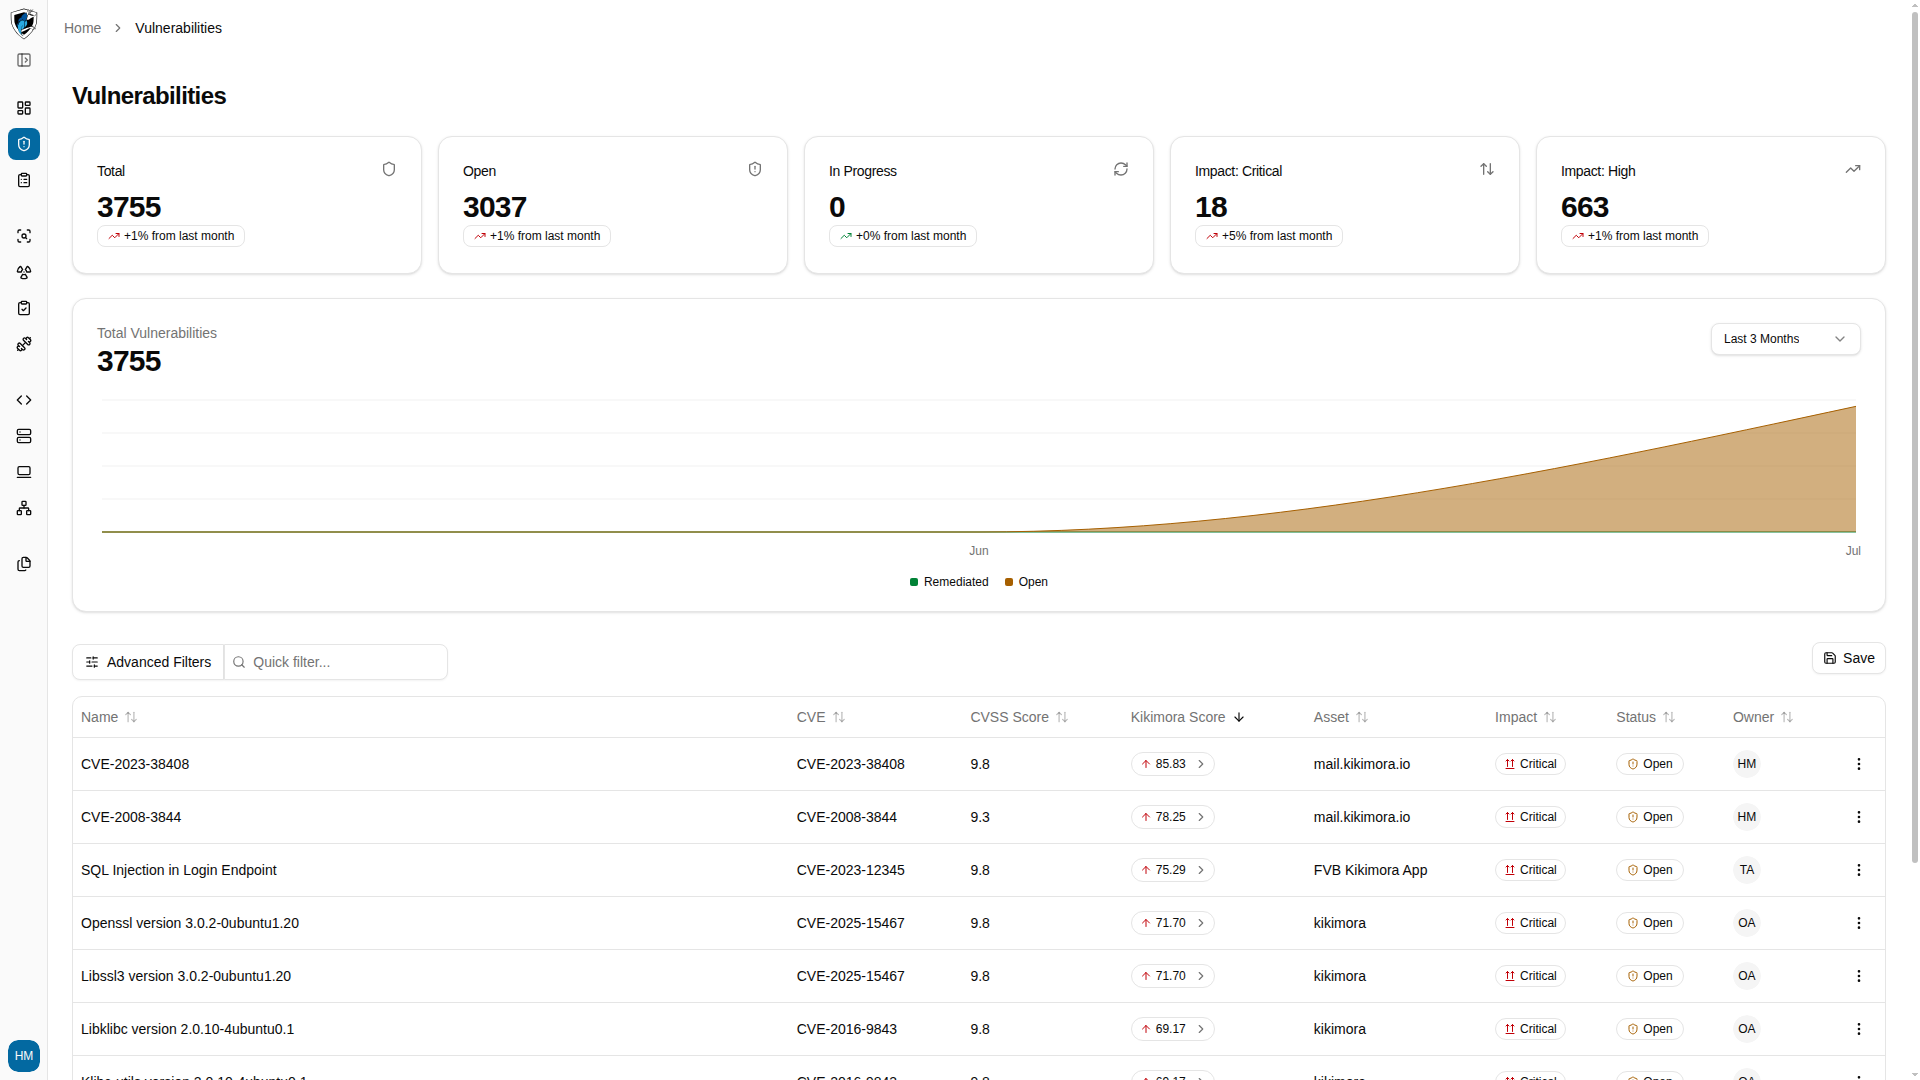
Five cards at the top of the page give you the shape of your backlog at a glance:- Total — every vulnerability detected across all assets, for example
3,763. - Open — unresolved findings awaiting remediation, for example
3,045. - In Progress — findings currently assigned or under active remediation.
- Impact: Critical — findings graded Critical, for example
20. - Impact: High — findings graded High, for example
666.
Total Vulnerabilities chart
Below the stat cards, the Total Vulnerabilities chart plots your findings over time, split into Remediated and Open series. The selector at its top right sets the window — Last 7 Days, Last 3 Months, or Last 6 Months.Table columns
Filtering, sorting, and pagination
- Advanced Filters — the button above the table opens a drawer where you can filter by Asset, Status, Impact, Owner, or Detection Source. Clear All inside the drawer resets every active filter.
- Sorting — click a column header such as CVSS Score or Kikimora Score to sort ascending or descending.
- Pagination — the controls at the bottom right set Rows per page (10, 20, 50) and move between pages.
Browse the table
-
Open the Vulnerabilities module to see the stat cards, the trend chart, and the findings list.
- Click the Columns selector at the bottom left to show optional columns such as Time to Resolve.
- Click Advanced Filters to narrow findings by asset, status, or severity. Clear All resets them.