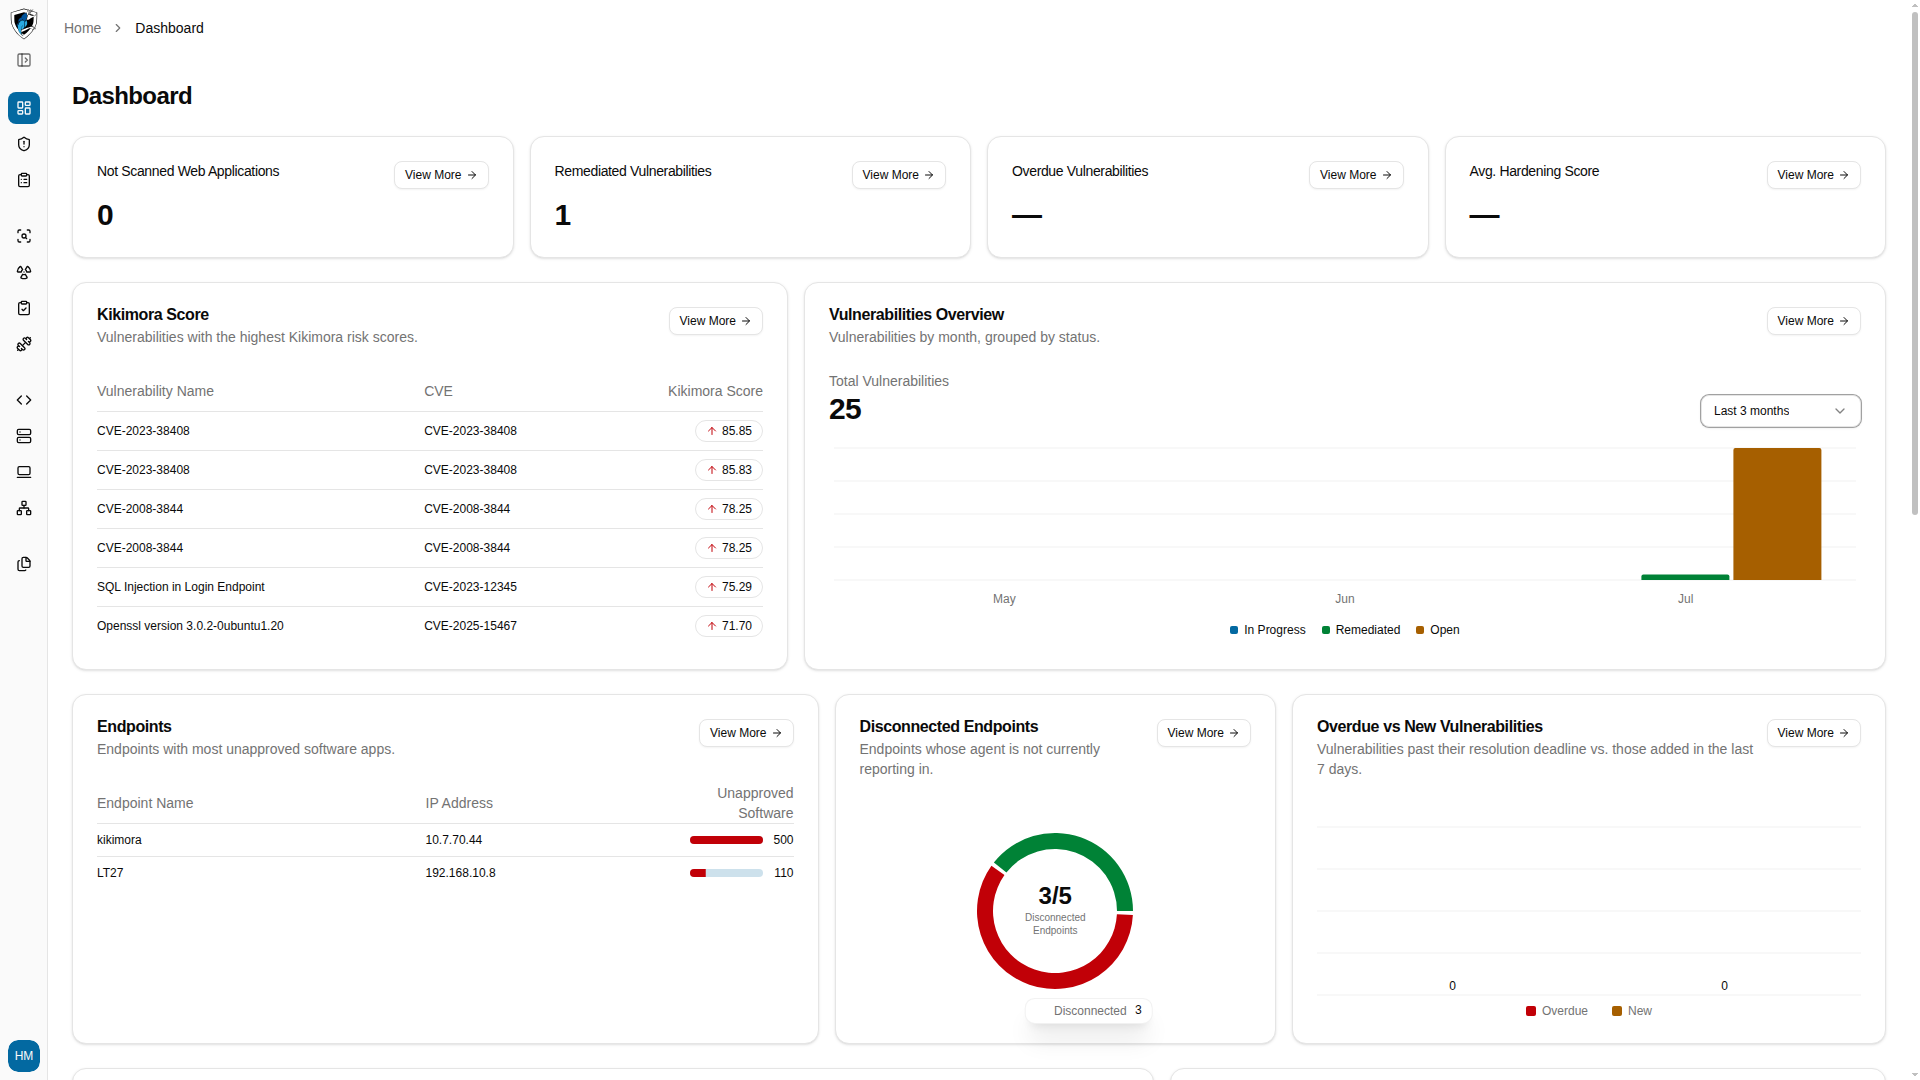

Time ranges
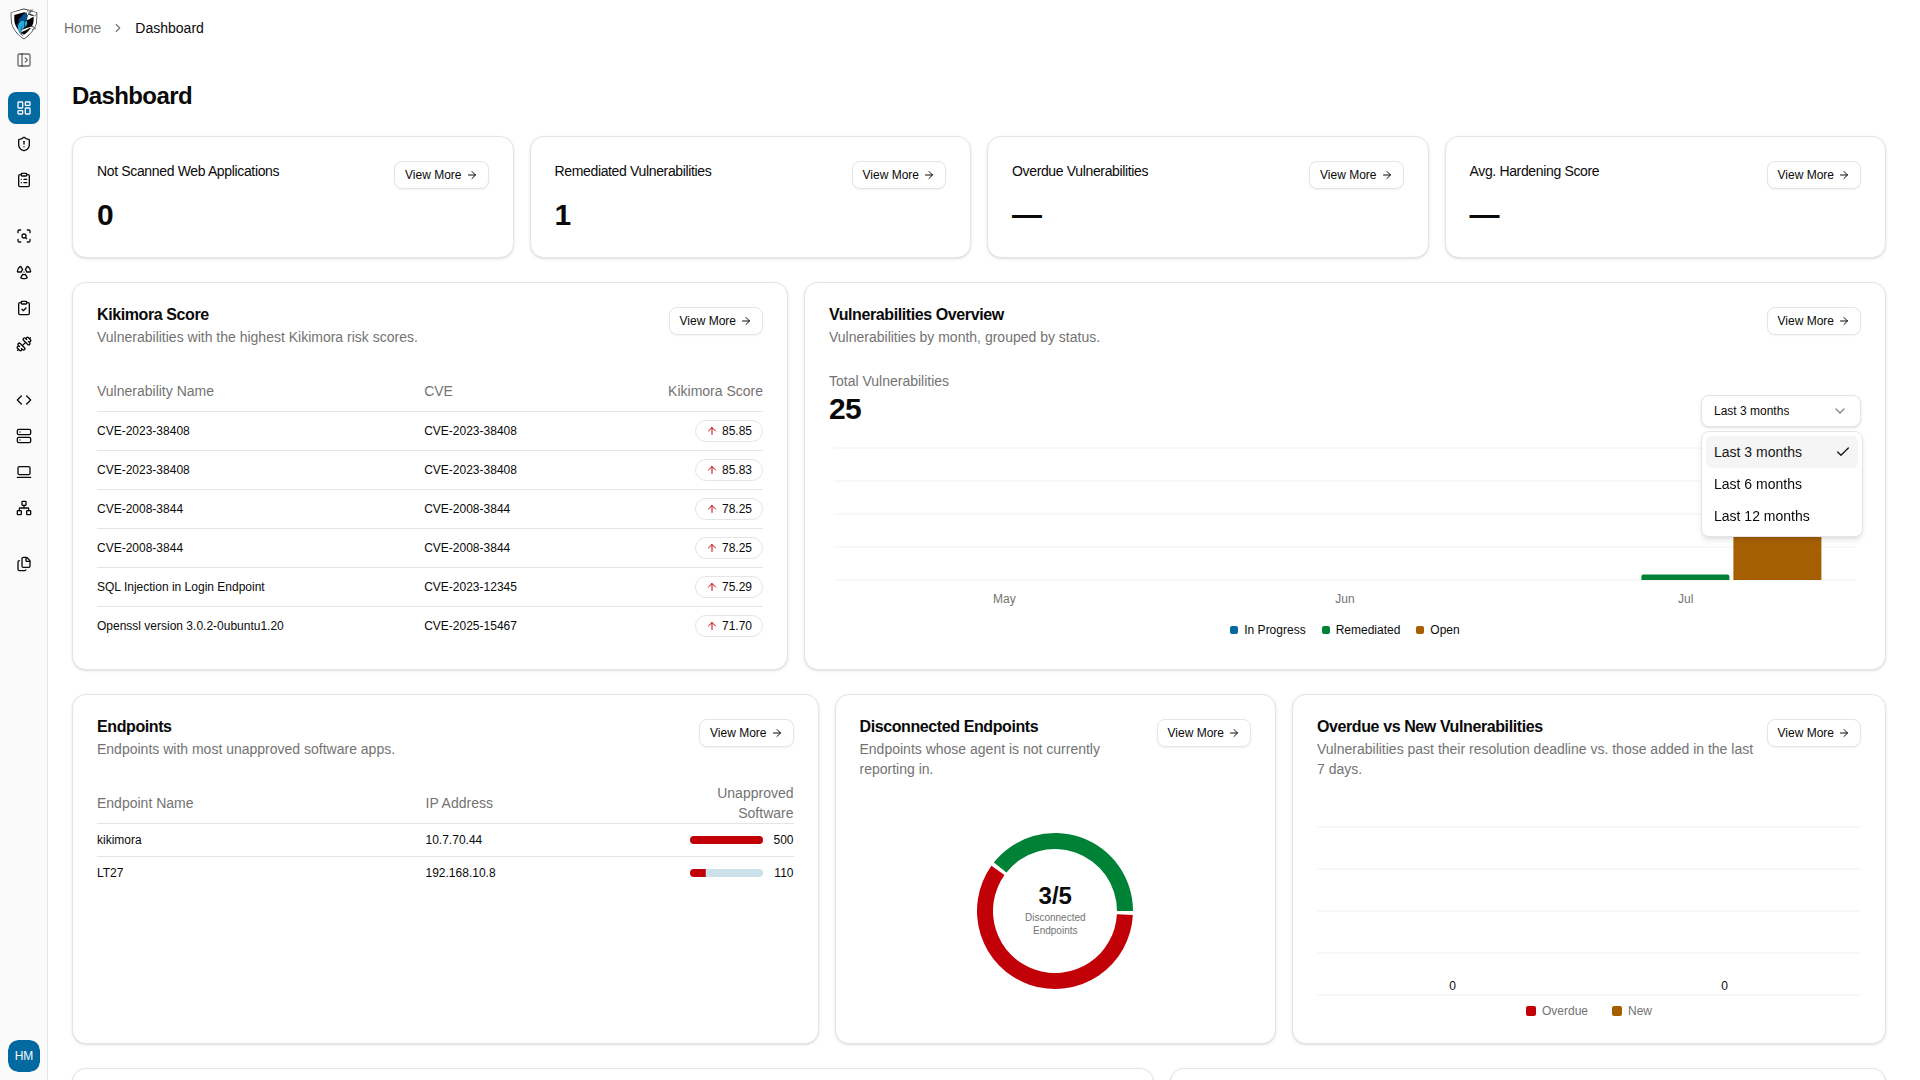
The range selector sits in the top-right corner of the chart header. Three windows are available:- Last 3 months (default)
- Last 6 months
- Last 12 months
Change the range and read a tooltip
-
Click the range selector at the top right of the Vulnerabilities Overview chart header to open the list of windows.
-
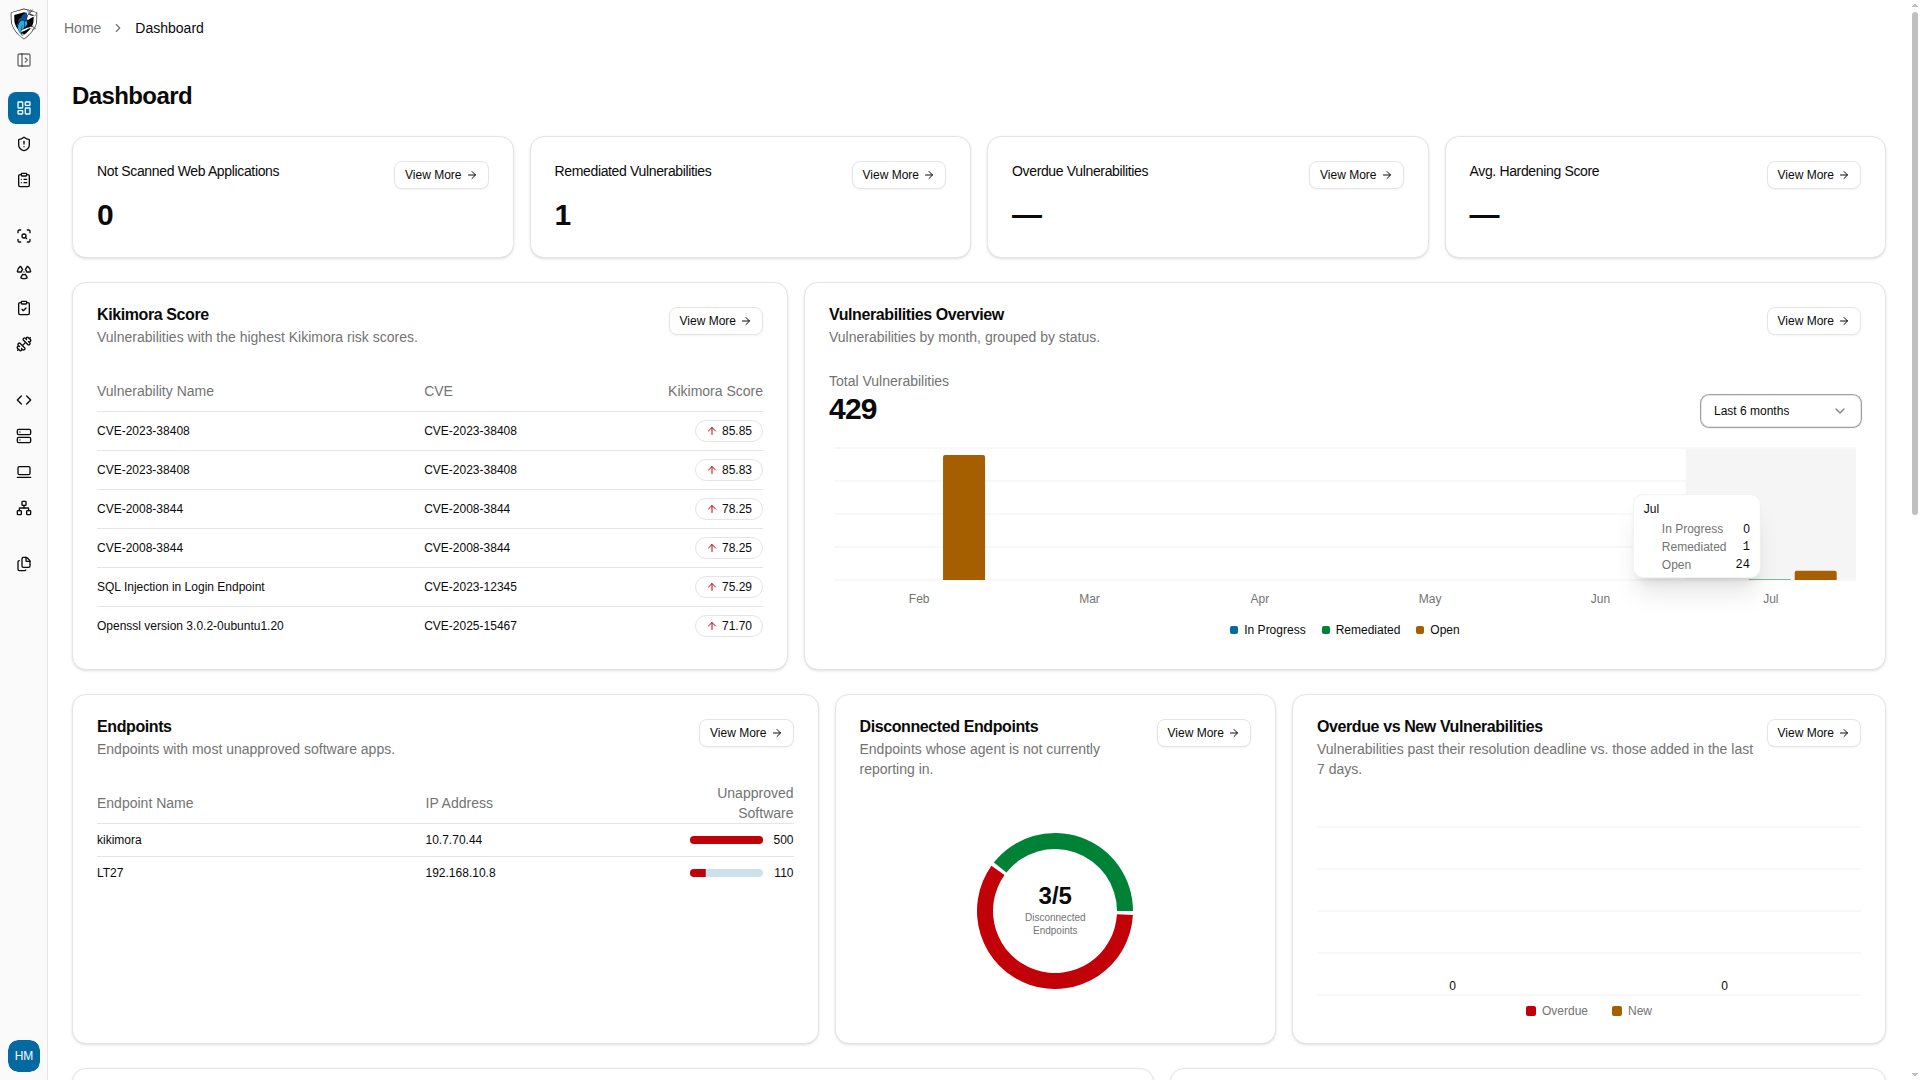
Click the window you want, such as Last 6 months. The chart redraws immediately.
-
Hover any bar to open its tooltip, which breaks that period down into Open, Remediated, and In Progress counts.