

Key concepts
- External attack surface — the assets exposed to the public internet that an adversary could target.
- Domains and hostnames — domain names and their associated hostnames, discovered through DNS lookup or SSL certificate data.
- IP addresses — IPv4 addresses associated with discovered hostnames, or added directly as standalone targets.
- Vulnerabilities count — the flaws detected on each monitored asset, categorized Critical, High, Medium, and Low.
- Tenant and risk owner attribution — ownership metadata assigning each asset an administrative domain. Available to tenant admins.
The overview chart
The Exposure page opens with two visuals. Vulnerabilities is a donut chart totalling the findings across your monitored assets and splitting them by severity — hovering a segment reveals the exact count behind it. Vulnerable Services is a bar chart breaking those findings down by the service that carries them, such as OpenSSH, again coloured Critical, High, Medium, and Low. Neither has a time period selector; both render current state.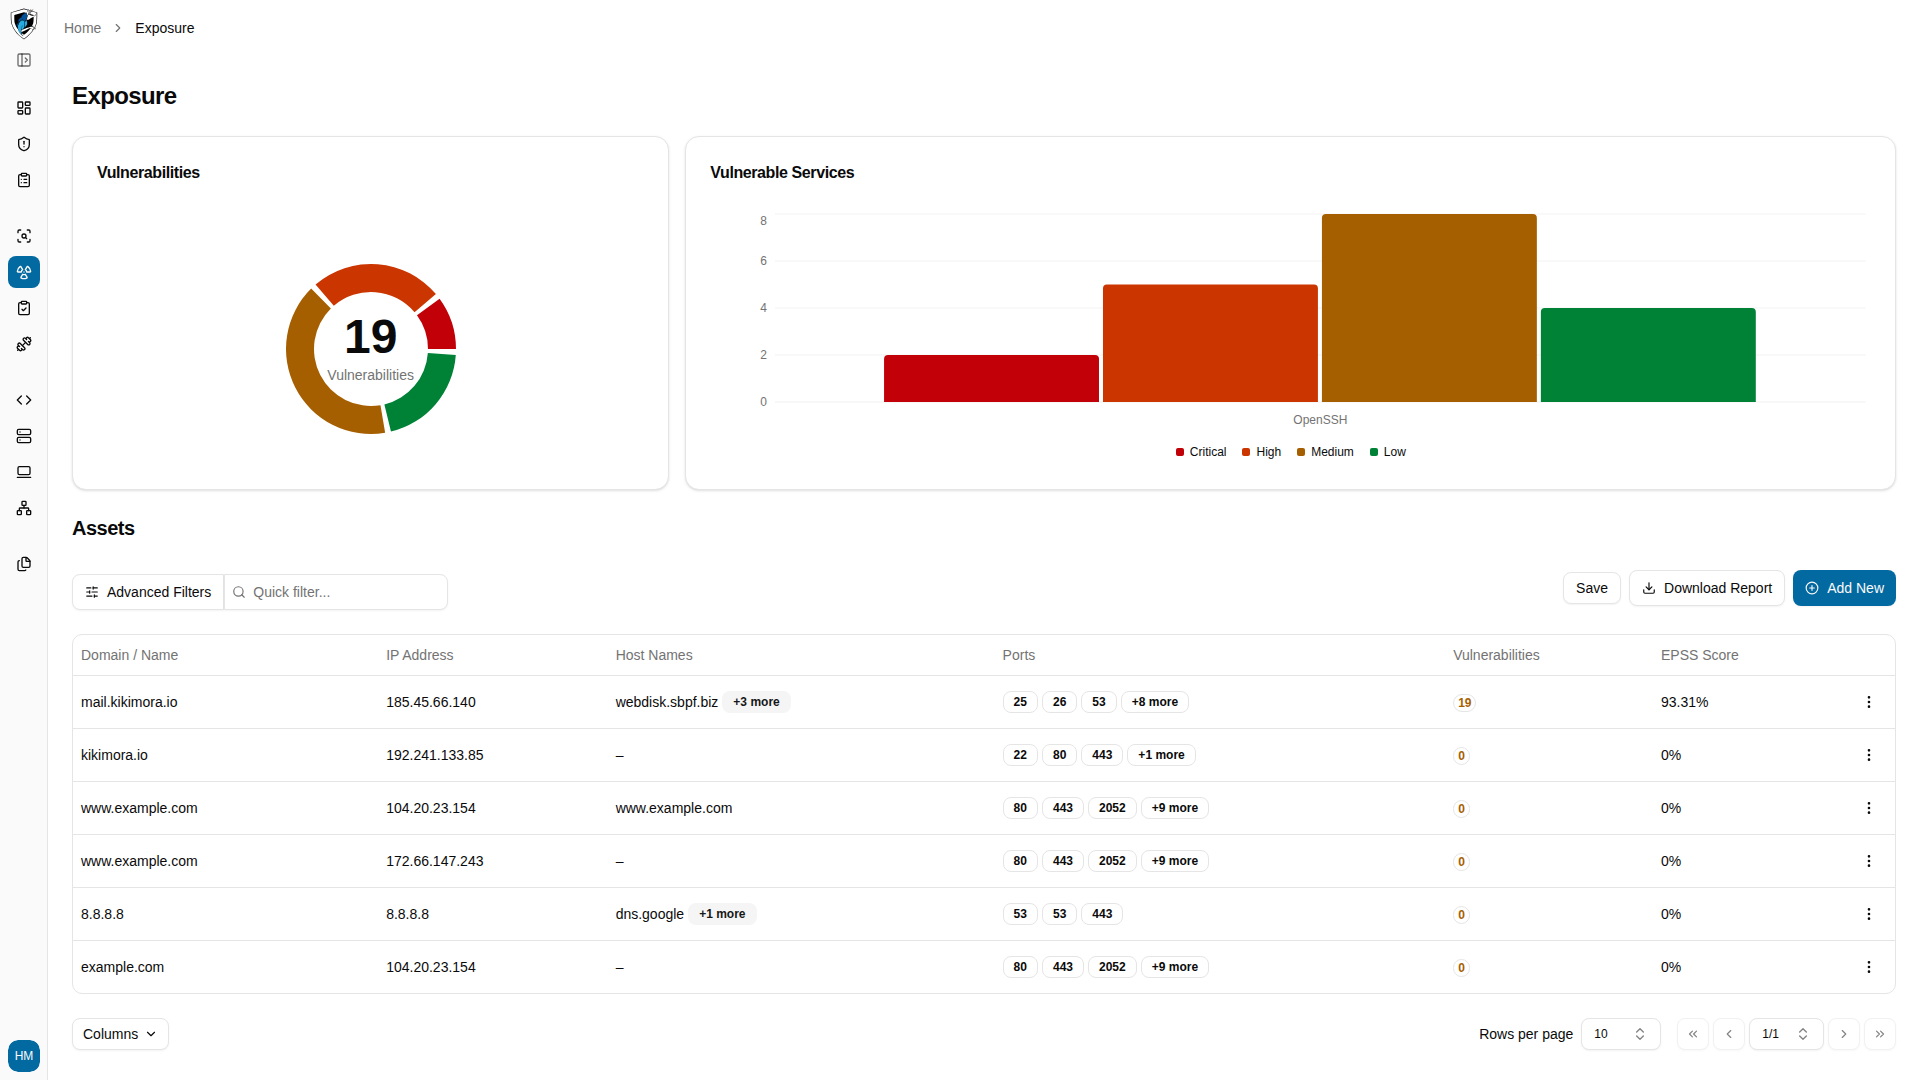
”+N more” pills
When an asset has more hostnames, IP addresses, or domains than fit in a table cell, the cell collapses the remainder into a pill such as+2 more. Hover the pill to see the full list.
Download report
Download Report, at the top right of the Exposure page, exports every current external asset finding — IP allocations, domain candidate statuses, and detected vulnerability counts.Related modules
- Infrastructure — view and manage stored internal and external infrastructure assets.
- Vulnerabilities — full finding details, CVE definitions, and remediation workflow.
- Dashboard — aggregated posture metrics across every module.