> ## Documentation Index
> Fetch the complete documentation index at: https://docs.kikimora.io/llms.txt
> Use this file to discover all available pages before exploring further.
# Inspecting asset details
> Open an exposure asset to review its CVEs, EPSS exploit-prediction scores, and the open ports and service banners discovered on it.
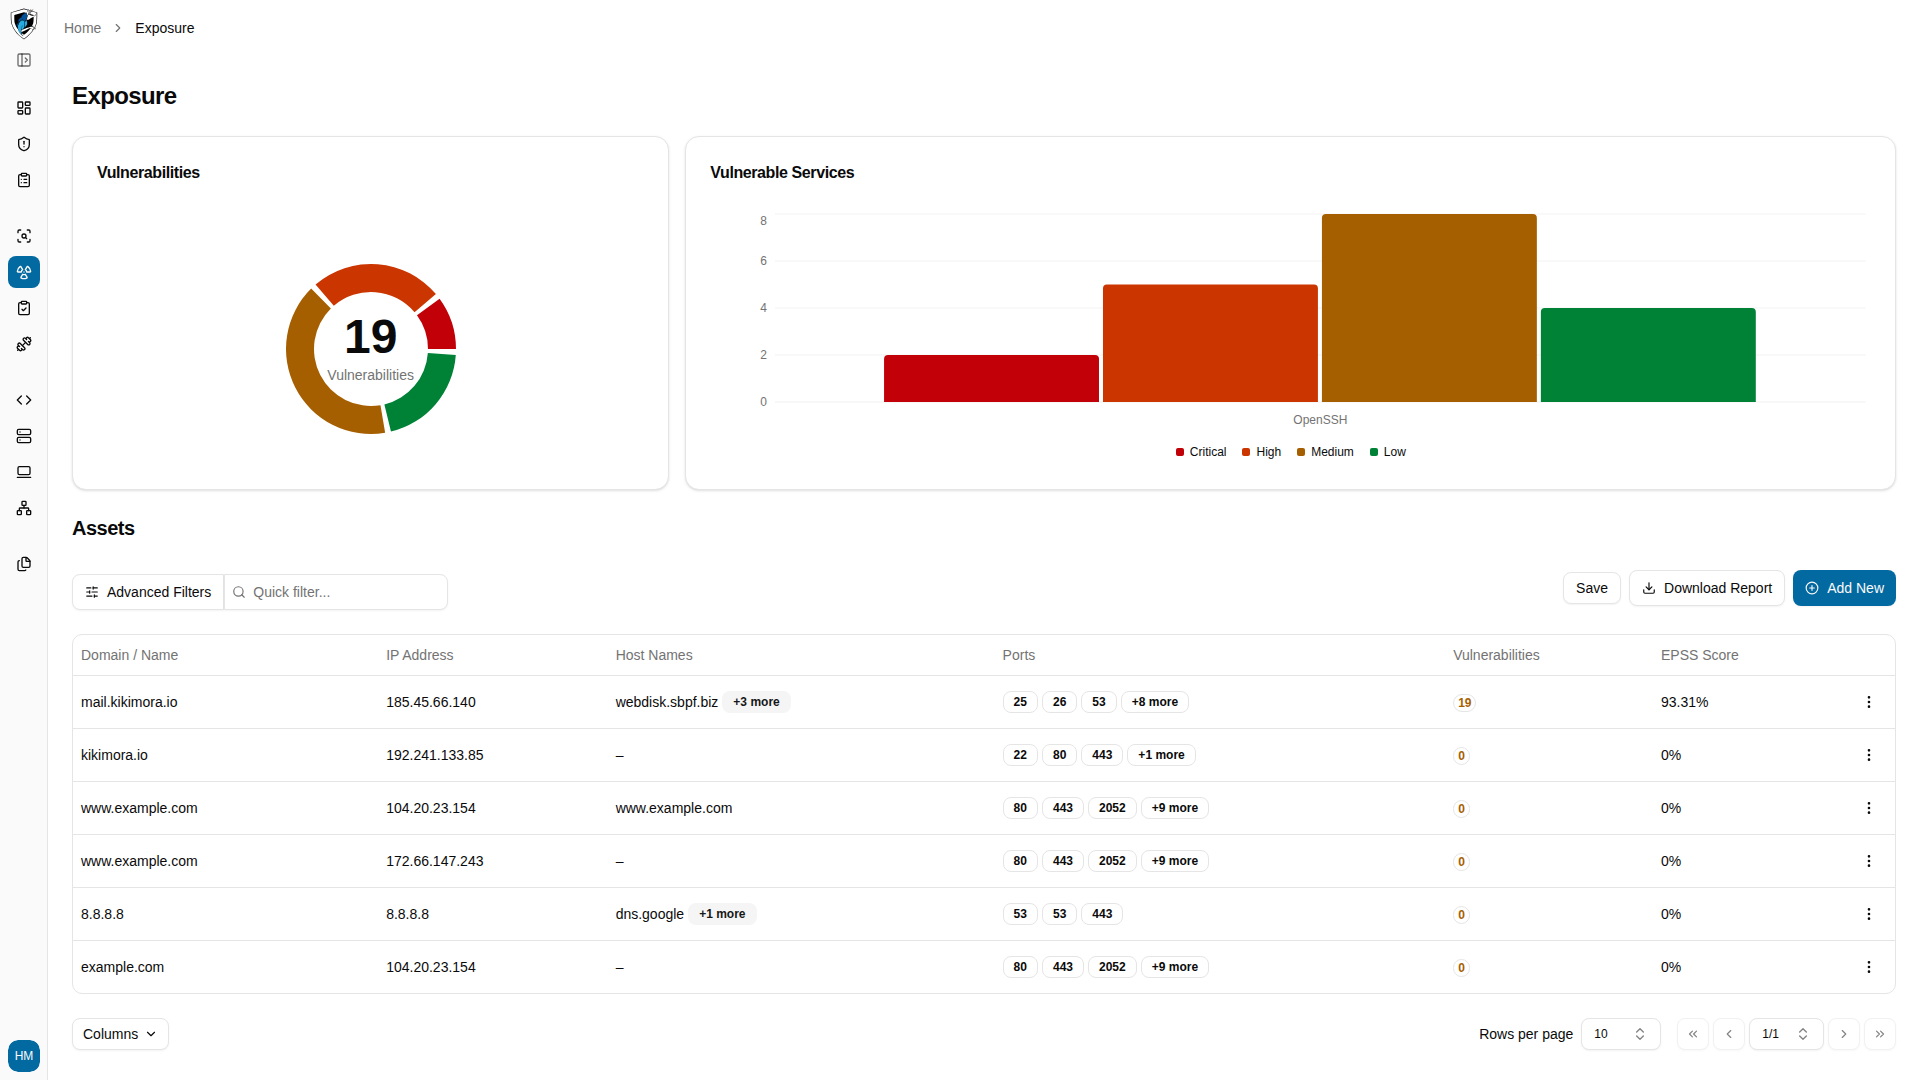
Every asset in the Exposure table opens into a detail view where you can inspect what discovery found on it.
## What the detail view shows
* **Clickable cells** — both the **Domain / Name** and **IP Address** cells in the Exposure table are links that open the asset's detail view.
* **Vulnerabilities** — the CVEs associated with the asset, grouped into Critical, High, Medium, and Low tabs.
* **EPSS scores** — the Exploit Prediction Scoring System percentage for each discovered CVE, indicating how likely that vulnerability is to be exploited in the wild.
* **Port information** — the ports discovered open on the asset, the service running on each, and the raw service banner captured from it.
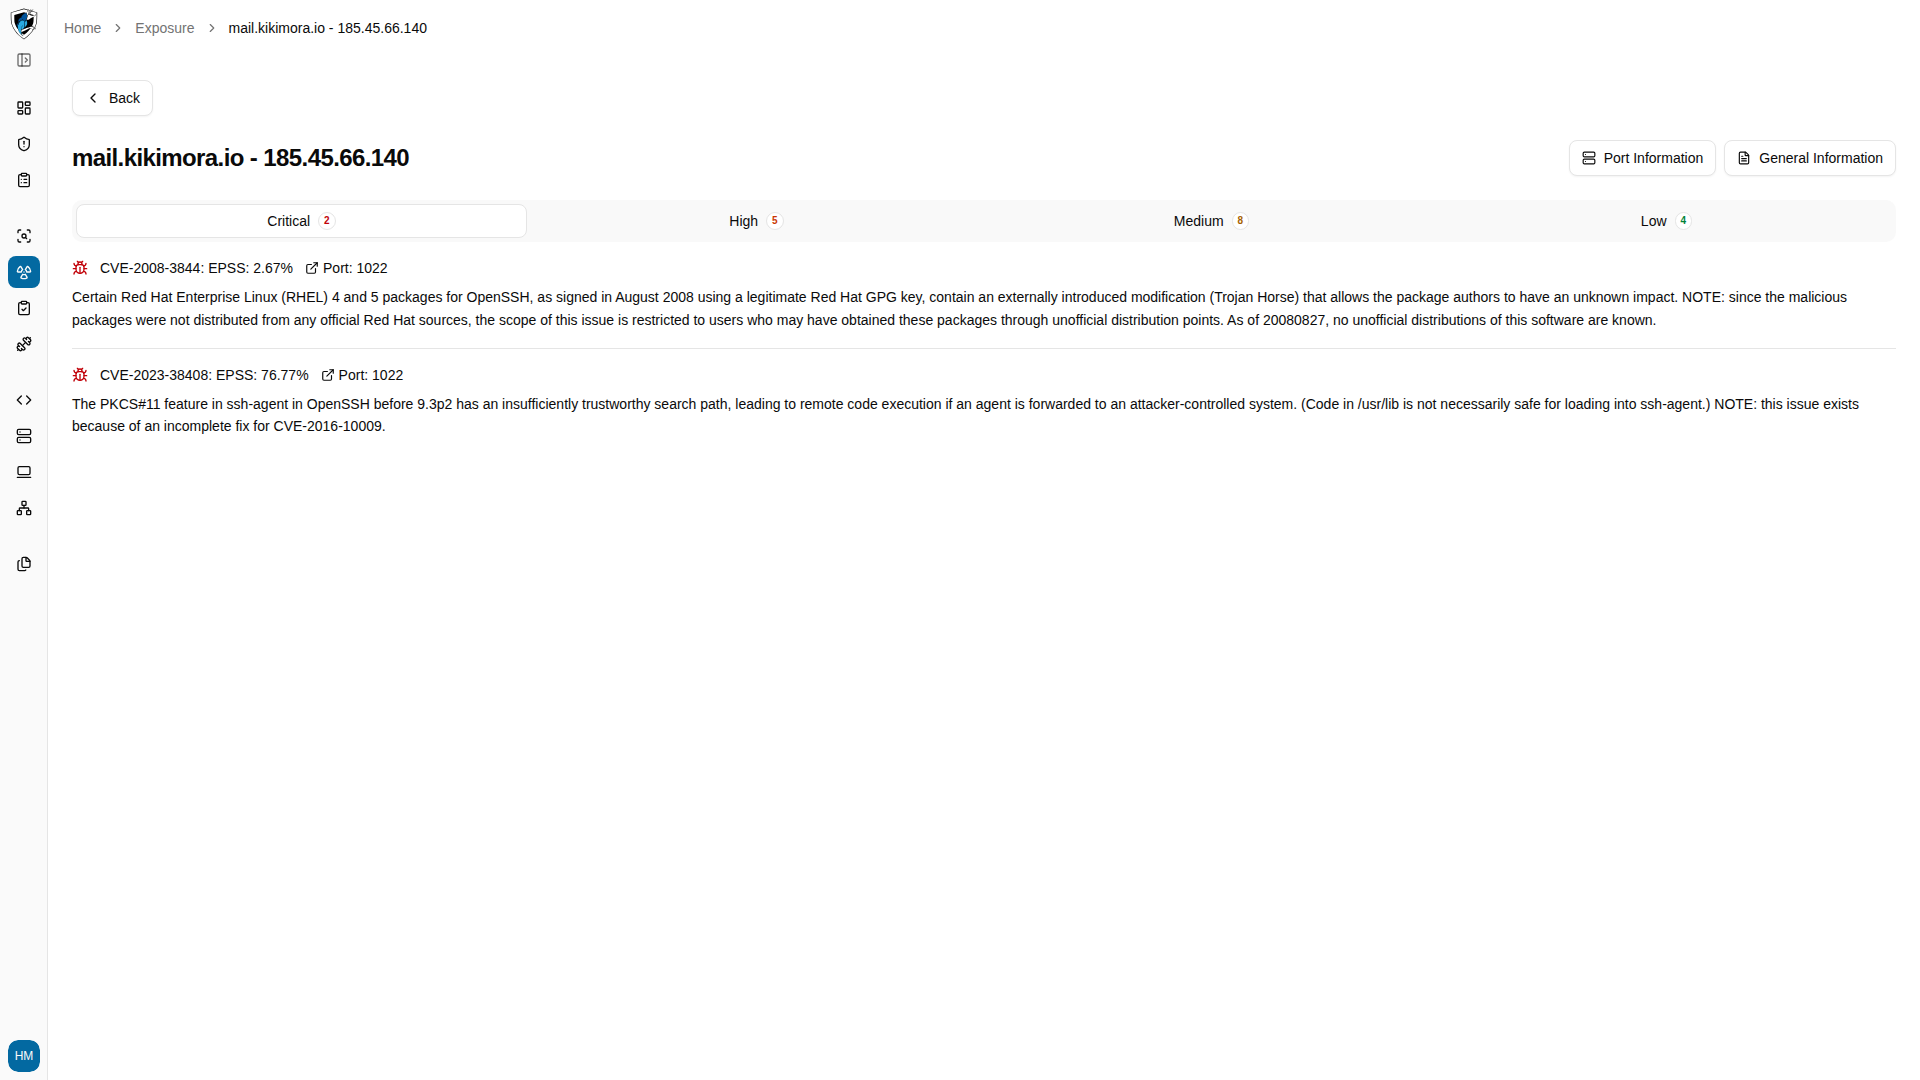
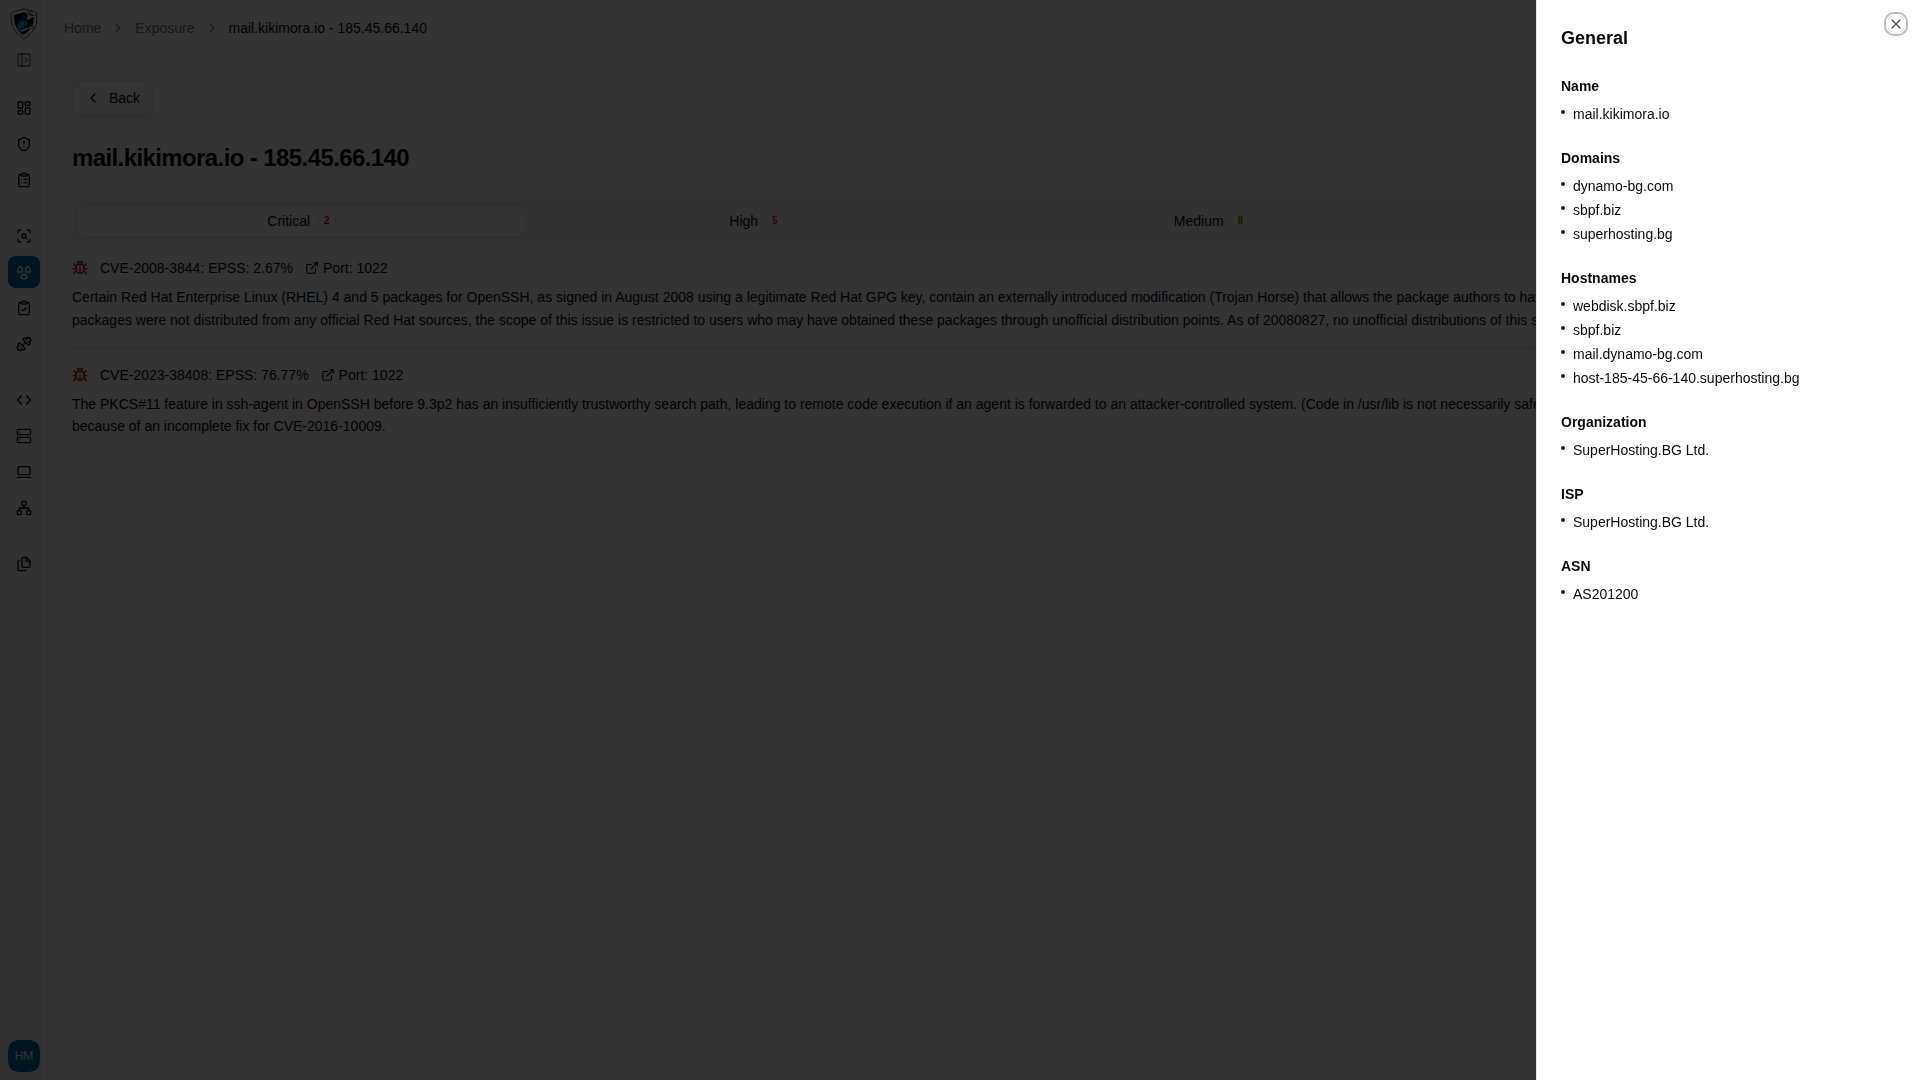
* **General information** — the asset's name, its associated domains and hostnames, and the organization, ISP, and ASN that own its IP address.
## Inspect an asset
1. In the Exposure table, click any domain name or IP address link.
 2. The asset detail view opens on its vulnerabilities, grouped into **Critical**, **High**, **Medium**, and **Low** tabs. Each entry shows its CVE, EPSS percentage, the port it was found on, and a description.
 3. Click **General Information** for the asset's identity and hosting metadata: **Name**, associated **Domains** and **Hostnames**, and the **Organization**, **ISP**, and **ASN** behind its IP address.
 4. Click **Port Information** to open the **Port Logs** panel, then select a port from the **Select port** combobox to see the service name and its raw banner output. When no log has been captured for the selected port, the panel reads `No details available for port .`